 how-to
Measuring Success in Waste Fleet Training
Table of Contents
- Why Measuring Waste Fleet Training Success Matters
- Establishing Baseline Metrics Before Training Begins
- Fleet Management KPIs That Track Training Impact
- Driver Safety Training Metrics and Behavioral Change
- Calculating Fleet Training ROI: A Step-by-Step Approach
- Step 1: Define Your Training Investment Costs
- Step 2: Isolate Training Impact from Other Variables
- Step 3: Quantify Measurable Operational Improvements
- Step 4: Calculate Net Benefit, ROI Percentage, and Payback Period
- Step 5: Track ROI Over Time and Adjust for Sustainability
- Step 6: Account for Reinforcement Costs and Diminishing Returns
- Real-World ROI Examples in Waste Operations
- Real-Time Monitoring and Telematics Data Integration
- Common Mistakes in Training Measurement and How to Avoid Them
- Building a Continuous Improvement Cycle
- Frequently Asked Questions
Last Updated: September 27, 2026
Why Measuring Waste Fleet Training Success Matters
Without the right metrics, you won't know if training is working. Many fleet managers invest in programs and hope for results without tracking what changes.
Most waste operations measure activity, not impact, counting training sessions rather than measuring what drivers actually do differently on the job. Training programs run, teams attend, but breakdowns continue and costs stay high because nobody can prove training delivered value.
This guide shows you how to measure waste fleet training success by identifying key metrics, connecting training to operational improvements, and building a system that demonstrates real ROI.
Establishing Baseline Metrics Before Training Begins
You can't measure improvement without establishing baseline metrics. Before training begins, document your current state:
- Daily breakdown frequency
- Road calls per week
- Maintenance costs per vehicle
- Fuel consumption per route
- Driver incidents or safety violations
- Vehicle downtime hours per month
- Route completion times
- Preventative maintenance compliance rates
These become your baseline figures, your starting point for comparison. Measure for at least 30 days before training starts; one week is insufficient due to seasonal variation and random equipment failures. Document baseline data in a spreadsheet with dates, vehicle IDs, and specific numbers.
Fleet Management KPIs That Track Training Impact
Training in waste fleet operations should move specific needles. These KPIs directly measure whether your team is performing better after training.
Vehicle Use and Route Density
Vehicle use (actual hours ÷ available hours) and route density (stops per mile) both improve with better-trained drivers. Track weekly; most operations see measurable improvement within four weeks.
Maintenance Downtime and Preventative Maintenance Compliance
Measure total downtime hours per vehicle per month and preventative maintenance completion rates. Training focused on vehicle inspection reduces unexpected breakdowns by enabling technicians to catch issues early.
Total Cost Per Kilometer and Fuel Consumption
Calculate cost per mile by dividing total monthly operational costs by total miles driven. Fuel consumption is directly influenced by driver behavior; training emphasizing smooth operation cuts fuel spend noticeably.
Driver Safety Training Metrics and Behavioral Change
Measuring whether safety training changes behavior, not just attendance, is where most waste operations fall short. Measuring behavioral change requires tracking specific, observable actions before and after training, then monitoring compliance over time.
Pre- and Post-Training Incident Metrics
Categorize incidents by type (traffic/collision, property damage, pedestrian interactions, equipment handling, distracted driving, speeding). Measure incident frequency per driver for 60 days before training, then track for 90 days post-training in three 30-day windows. A 40% reduction in backing incidents but no change in speeding indicates training addressed the specific topic covered.
Knowledge Retention and Compliance Scoring
Administer practical knowledge assessments immediately after training and 30 days later. If your team averages 85% post-training and 72% at 30 days, you've experienced 13-point knowledge decay. Track whether decay stabilizes or continues declining.
Measure compliance using telematics data, supervisor observations, or self-reporting. For example, if 160 of 200 weekly acceleration events are smooth, that's 80% compliance. Track weekly for 90 days: weeks 1-4 show highest compliance, weeks 5-8 typically dip as old habits resurface, and weeks 9-12 reveal if behavior is becoming habitual.
Customer Complaint Tracking and Service Quality Impact
Track driver-behavior complaints separately from operational complaints per 1,000 pickups completed. Safety training often reduces complaints by 20-30% within 60 days. Link complaint reduction to customer retention; in waste collection, a single customer represents $5,000-$15,000 in annual revenue.
Near-Miss Reporting and Safety Culture Indicators
Near-misses are leading indicators of safety culture. After safety training, near-miss reporting often increases initially, a positive sign indicating drivers are more aware of hazards. A 50% increase in near-miss reports combined with a 30% decrease in actual incidents suggests drivers are catching problems before they become accidents.
Calculating Fleet Training ROI: A Step-by-Step Approach
ROI calculation connects training costs to operational savings. Benefits are behavioral and often overlap with other operational changes, making isolation important.
Step 1: Define Your Training Investment Costs
Include all training expenses: trainer fees, travel, facility rental, lost productivity (drivers × hourly wage × training hours), materials, follow-up coaching, and technology costs. For a 50-driver full-day safety training: external trainer ($2,000-$5,000), facility rental ($500-$1,500), lost productivity ($8,800), materials ($500-$1,000) = $11,800-$16,300 total. Accurate cost accounting makes ROI credible.
Step 2: Isolate Training Impact from Other Variables
This is where most waste operations fail at ROI calculation. When you train your team and fuel costs drop, multiple factors might be responsible:
- Fuel prices might have fallen nationally
- Route optimization software might have been implemented simultaneously
- Seasonal demand might have shifted
- A new vehicle with better fuel economy might have entered the fleet
- Hiring of more experienced drivers might have occurred
Use a control group (train one depot, leave another untrained for 60 days) or time-series analysis (compare rate of change before and after training).
Step 3: Quantify Measurable Operational Improvements
This is where baseline metrics matter. Compare your post-training performance to your baseline, using the same 30-day measurement windows.
Downtime Reduction:
- Baseline: 120 hours of vehicle downtime per month across your fleet
- Post-training (month 1): 95 hours
- Improvement: 25 hours
- Cost per downtime hour: $150 (lost revenue + labor + overhead)
- Monthly savings: 25 hours × $150 = $3,750
Fuel Consumption Reduction:
- Baseline: 15,000 gallons per month, $3.50/gallon = $52,500/month
- Post-training (month 1): 14,100 gallons per month = $49,350/month
- Improvement: 900 gallons saved
- Monthly savings: 900 × $3.50 = $3,150
Maintenance Cost Reduction:
- Baseline: $8,000/month in unplanned maintenance
- Post-training (month 1): $6,200/month
- Monthly savings: $1,800
Incident and Accident Cost Reduction:
- Baseline: 3 accidents per month, average cost $2,500 per accident = $7,500/month
- Post-training (month 1): 2 accidents per month = $5,000/month
- Monthly savings: $2,500
- (Include insurance premium reductions if your carrier offers safety discounts; these often take 6+ months to appear)
Step 4: Calculate Net Benefit, ROI Percentage, and Payback Period
Net Benefit = Total improvements over measurement period − Total training costs
Book My Complimentary Discovery Call →
Using the example above:
-
Training cost: $14,000 (midpoint of $11,800-$16,300)
-
Monthly improvements: $46,200
-
Three-month improvements: $46,200 × 3 = $138,600
-
Net benefit (3 months): $138,600 − $14,000 = $124,600
-
ROI = ($124,600 ÷ $14,000) × 100 = 890% over three months
-
Annualized ROI = 890% × 4 = 3,560% annually (if improvements sustain)
Payback Period = Training cost ÷ Monthly improvements
- Payback period = $14,000 ÷ $46,200 = 0.3 months, or about 9 days
Step 5: Track ROI Over Time and Adjust for Sustainability
The improvements calculated above assume month 1 performance continues indefinitely. In reality, behavioral change decays without reinforcement.
Track the same metrics in months 2 and 3:
-
Month 1 improvements: $46,200 (peak, right after training)
-
Month 2 improvements: $41,000 (some decay as old habits resurface)
-
Month 3 improvements: $38,500 (further decay, but stabilizing)
-
Average monthly improvement: $41,900
-
Six-month net benefit: ($41,900 × 6) − $14,000 = $237,400
-
Twelve-month net benefit: ($41,900 × 12) − $14,000 = $488,800
Step 6: Account for Reinforcement Costs and Diminishing Returns
Behavioral change requires reinforcement. After 90 days, many drivers revert partially to old habits. Plan for refresher training or coaching.
- Year 1 training costs: $14,000 (initial) + $6,000 (two refreshers) = $20,000
- Year 1 improvements: $41,900 × 12 = $502,800
- Year 1 net benefit: $502,800 − $20,000 = $482,800
- Year 1 ROI: ($482,800 ÷ $20,000) × 100 = 2,414%
Real-World ROI Examples in Waste Operations
Safety Training ROI: A 50-truck fleet invests $25,000 in comprehensive safety training. Incident rates drop 35%, saving $18,000 in accident costs per month. Payback period: 1.4 months. Annualized ROI: 8,640%.
Real-Time Monitoring and Telematics Data Integration
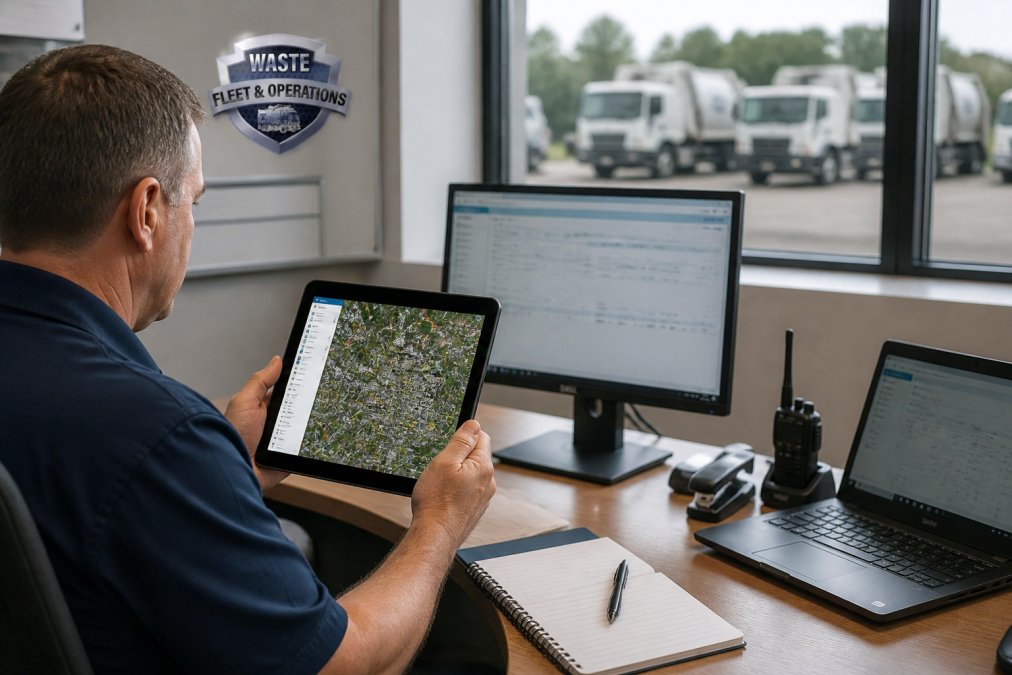
Modern waste fleets generate enormous amounts of data. Telematics systems track vehicle location, speed, fuel consumption, engine diagnostics, and driver behavior in real time.
Common Mistakes in Training Measurement and How to Avoid Them
Most waste operations make predictable errors when measuring training success. Knowing these mistakes helps you avoid them.
Building a Continuous Improvement Cycle
Measuring training success is the foundation for continuous improvement. Create a cycle: measure baseline → identify opportunity → design training → track metrics → analyze results → adjust → repeat. This compounds over time as each program builds on lessons from the previous one. Build your own measurement system rather than copying templates; when you track metrics consistently, you see patterns and build institutional knowledge about what drives improvement in your operation.
Frequently Asked Questions
What are the most critical KPIs for measuring waste fleet training success?
The most critical fleet management KPIs include vehicle utilization rates, maintenance downtime reduction, total cost per kilometer, fuel consumption efficiency, incident rate reduction, and preventative maintenance compliance. Training effectiveness directly impacts these metrics. Track baseline figures before training begins, then monitor weekly or monthly changes. Most waste haulers see measurable improvements in breakdown frequency and route efficiency within 4-6 weeks of structured training implementation.
How do you calculate the ROI of a waste fleet training initiative?
Calculate fleet training ROI by dividing net benefit by total training investment, then multiplying by 100. Net benefit equals measurable cost reductions (fewer breakdowns, reduced fuel waste, lower maintenance costs) minus training expenses. Document baseline metrics before training, track improvements for 90 days, and account for both direct savings and indirect benefits like reduced road calls and improved driver retention.
What driver safety training metrics actually indicate that training is working?
Driver safety training metrics include incident rate reduction, near-miss reporting frequency, accident-free days, compliance with safety protocols, and telematics data showing smoother acceleration and braking patterns. Behavioral change is the key indicator. Monitor whether drivers are performing pre-trip inspections consistently, following speed limits on routes, and reporting vehicle issues proactively. Real-world effectiveness shows up in reduced insurance claims, lower workers' compensation costs, and fewer preventable breakdowns caused by operator error or neglect.
How often should you evaluate the effectiveness of waste fleet training?
Evaluate training effectiveness monthly during the first three months, then quarterly thereafter. Early evaluation helps identify which training elements are sticking and where reinforcement is needed. Monthly reviews allow you to catch behavioral drift before it becomes costly. After establishing solid baseline performance, quarterly evaluations are sufficient to ensure continuous improvement and identify emerging issues. Use real-time monitoring systems and telematics data to track performance between formal reviews.