 how-to
Calculate ROI for Waste Fleet Consulting: A Step-by-Step Guide
Table of Contents
- Why Calculate ROI for Waste Fleet Consulting
- Step 1: Establish Your Current Baseline Costs
- Step 2: Calculate Fleet Downtime Costs
- Step 3: Measure Waste Fleet Maintenance Cost Reduction
- Step 4: Define Waste Hauler Operational Efficiency KPIs
- Step 5: Apply the ROI Formula and Benchmark Results
- Step 6: Account for Soft Savings and Compliance ROI
- Common Mistakes When Calculating Fleet ROI
- Frequently Asked Questions
Last Updated: October 2, 2026
Why Calculate ROI for Waste Fleet Consulting
When you invest in fleet consulting, you need to know exactly what you're getting back, which is why you must calculate ROI waste fleet performance to measure real returns. Most waste haulers operate on thin margins, so every dollar spent should generate measurable savings or efficiency gains. Calculating ROI for waste fleet consulting forces you to think clearly about what you're spending, what you expect to gain, and whether the investment actually delivers.
This guide walks you through the exact process to establish baselines, calculate cost reductions, and apply a formula that reflects your operation's reality.
Step 1: Establish Your Current Baseline Costs
You can't measure improvement without knowing where you started. Pull together your operational costs from the last 12 months using actual numbers from your accounting system, maintenance logs, and fuel records.
Identifying Direct Operational Expenses
Your main direct costs include:
- Fuel expenses, total gallons purchased multiplied by average price per gallon
- Driver wages, total compensation including salary, benefits, and payroll taxes
- Vehicle payments or lease costs, monthly or annual capital costs
- Insurance premiums, liability, collision, and comprehensive coverage
- Routine maintenance, scheduled oil changes, filter replacements, inspections
- Parts inventory, spare parts kept on hand for quick repairs
Add these up for your entire fleet over 12 months to establish your baseline for direct operational expenses.
Measuring Hidden Costs
Hidden costs are real expenses that don't appear in a single line item:
- Downtime labor, mechanics and shop staff standing idle while vehicles are down
- Administrative overhead, dispatcher time managing breakdowns, office staff handling roadside calls
- Towing and roadside service, cost to get broken-down vehicles off the road
- Lost productivity, revenue not generated while a vehicle sits in the shop
- Expedited shipping, paying extra to get replacement parts quickly
- Customer penalties, missed pickups or service delays that trigger penalties
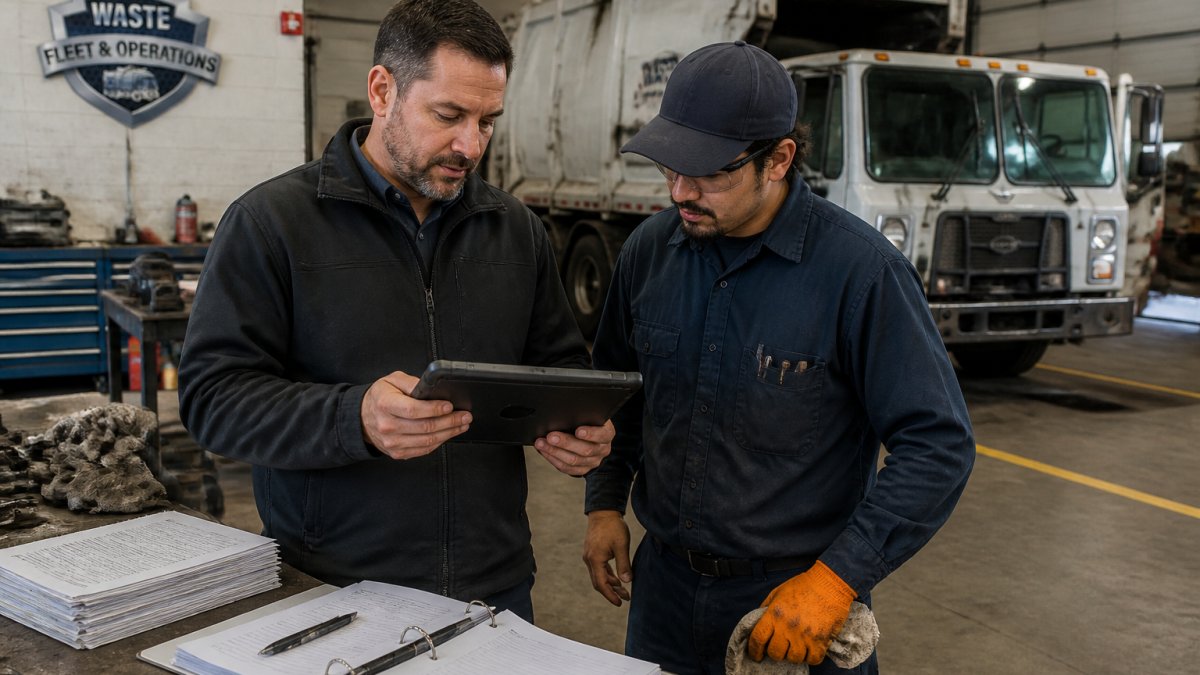
To calculate hidden costs, track how many hours per month your vehicles spend in the shop or broken down on the road, then multiply by your fully loaded hourly cost. Many waste haulers find hidden costs are a significant portion of direct operational costs.
Step 2: Calculate Fleet Downtime Costs
Downtime costs extend beyond repairs to include lost revenue, labor productivity, and customer satisfaction.
Road Call and Breakdown Frequency
Track road calls and breakdowns over the last three months, recording the date, vehicle ID, what failed, downtime duration, and repair cost. Most waste fleets experience road calls per month per 100 vehicles; above that range indicates a significant problem.
Revenue Loss Per Idle Vehicle
Calculate revenue loss per idle vehicle: divide annual revenue by fleet size, then by 250 working days to get daily revenue per vehicle. Multiply by idle days per month. Example: $2M revenue ÷ 50 vehicles ÷ 250 days = $160/day per vehicle. Five idle days per month = $800 loss per truck.
Step 3: Measure Waste Fleet Maintenance Cost Reduction
Preventive maintenance typically delivers the biggest immediate savings by shifting from reactive repairs to planned maintenance.
Preventive Maintenance Savings
Track maintenance in two categories: preventive (scheduled services) and reactive (emergency repairs). Most waste fleets operate with a higher ratio of reactive to preventive maintenance; best practice is to shift towards more preventive maintenance. When you shift the ratio, repairs become scheduled instead of emergencies and parts cost less. Example: if reactive repairs drop from $15,000 to $8,000 monthly, you've saved $7,000 per month.
Parts Inventory and Labor Efficiency
Organized parts inventory reduces cost and time by eliminating technician search hours and duplicate orders. A typical 20-50 vehicle fleet carries a significant amount in inventory; if a portion is waste or obsolete, you're leaving thousands on the shelf. Better management increases asset use and reduces maintenance costs.
Step 4: Define Waste Hauler Operational Efficiency KPIs
Key performance indicators tell you whether your fleet is actually improving. Without clear KPIs, you can't measure progress.
Route Optimization and Fuel Economy
Fuel is typically the second-largest expense after labor. Track MPG, idle time, route efficiency, and fuel cost per mile. Real gains come from driver behavior and vehicle maintenance. Set baselines and track monthly; a 5-10% fuel economy improvement is realistic within the first quarter.
Book My Complimentary Discovery Call →
Asset Use and Vehicle Lifecycle
Asset use is billable hours divided by available working hours per month. Most waste fleets operate with a certain percentage of asset use; the gap is downtime, maintenance, and inefficient routing. For vehicle lifecycle management, track maintenance costs as a percentage of vehicle value. When that exceeds a certain percentage annually, it's usually time to replace.
Driver Behavior and Safety Metrics
Driver behavior impacts maintenance costs, fuel consumption, and accident frequency. Track harsh acceleration, harsh braking, speeding, idle time, and accident frequency using telematics or maintenance records. Safer, smoother driving reduces maintenance costs and fuel consumption.
Step 5: Apply the ROI Formula and Benchmark Results
Now you have the data. Time to calculate ROI waste fleet consulting and determine whether your investment actually paid off.
The Standard ROI Calculation
ROI = (Gain from Investment - Cost of Investment) / Cost of Investment × 100. Example: $25,000 consulting cost with $98,000 total gains ($45,000 maintenance reduction + $35,000 downtime savings + $18,000 fuel improvement) = 292% ROI, or $3.92 back per dollar spent. Waste fleet consulting can generate significant ROI within the first year.
Total Cost of Ownership Analysis
Total cost of ownership (TCO) includes capital, fuel, maintenance, insurance, wages, overhead, and downtime costs. Calculate TCO per vehicle per year before and after consulting; the difference is your actual savings. A fleet reducing TCO by up to $750,000 year-over-year has achieved real financial impact.
Step 6: Account for Soft Savings and Compliance ROI
The numbers we've covered so far are hard savings, money you actually save. But there are soft savings too, and they're often worth more.
Human Capital ROI and Retention
When your fleet operates better, your people stay longer. Technicians who work on well-maintained equipment are happier. Drivers who drive better-maintained vehicles have fewer breakdowns and safer shifts. Managers who have visibility into their operations sleep better at night.
Turnover in waste fleet operations costs money. Recruiting, hiring, and training a new technician costs money. Losing an experienced driver costs money in recruitment and lost productivity while training someone new.
If better fleet operations reduce technician turnover by even one person per year, you've paid for consulting.
Regulatory Compliance and Risk Mitigation
Waste fleets operate under tight regulatory requirements. Vehicle maintenance standards, driver hours, safety inspections, the list goes on.
Common Mistakes When Calculating Fleet ROI
Most waste fleet managers make predictable mistakes when calculating ROI. Here's what to avoid.
| Calculation Step | What You're Measuring | Key Metrics |
|---|---|---|
| Baseline Costs | Current operational expenses | Fuel, labor, maintenance, insurance |
| Downtime Costs | Revenue and productivity loss from idle vehicles | Road calls per month, hours down, revenue per vehicle |
| Maintenance Reduction | Shift from reactive to preventive maintenance | Preventive vs. reactive spending, parts waste |
| Operational KPIs | Fleet efficiency and driver behavior | MPG, asset use, safety incidents |
| ROI Formula | Return on consulting investment | (Gains - Cost) / Cost × 100 |
| TCO Analysis | Total fleet cost per vehicle per year | Capital, fuel, maintenance, labor, overhead |
| Soft Savings | Non-financial benefits with financial impact | Employee retention, compliance risk reduction |
Frequently Asked Questions
What is the standard formula for calculating ROI in fleet management?
The basic ROI formula is: (Net Profit / Total Investment) × 100. For waste fleet consulting, Net Profit equals your total cost savings (downtime reduction, maintenance savings, fuel efficiency) minus the consulting investment. For example, if consulting costs $50,000 and generates $125,000 in savings, your ROI is ($125,000 - $50,000) / $50,000 × 100 = 150%. Most waste fleets see 1.5x to 2x ROI within three months of implementing preventive maintenance programs.
How do you calculate fleet downtime costs for waste haulers?
Multiply your daily revenue per vehicle by the number of breakdown days per month. Add towing costs and emergency repair premiums. Preventive maintenance training can reduce breakdowns, directly improving this metric.
What waste hauler operational efficiency KPIs matter most for ROI?
Track fuel economy (miles per gallon), idle time (hours engine running without moving), asset utilization (percentage of fleet actively generating revenue), route optimization (stops per hour), and preventive maintenance compliance (percentage of scheduled services completed on time). For waste fleets, also measure tipping fee impact and route density. These KPIs reveal where consulting delivers the biggest savings. Fuel economy improvements and idle time reduction are common outcomes from operational efficiency programs.
How do you account for soft savings like driver retention in waste fleet ROI?
Assign a dollar value to driver retention based on replacement costs: recruiting, training, and lost productivity typically cost money per driver. If consulting improves shop conditions and equipment reliability, reducing turnover saves money. Similarly, improved safety reduces accident costs (vehicle damage, insurance premiums, downtime). Document these non-direct savings separately in your ROI calculation as 'soft savings' or 'secondary benefits,' then add them to direct cost reductions for total ROI impact.