 how-to
Reduce Waste Truck Idling Costs: A Fleet Manager's Guide
Table of Contents
- Why Truck Idling Drains Your Fleet Budget
- How to Calculate Idling Fuel Costs for Your Fleet
- Engine Wear and Hidden Maintenance Costs from Idle Time
- Establishing a Fleet Idling Policy That Drivers Will Follow
- Truck Idle Reduction Technologies That Deliver ROI
- Truck Driver Idle Reduction Training: Changing Behavior on the Road
- Measuring and Validating Your Idling Reduction Results
- Conclusion: Building a Sustainable Idling Reduction Program
- Frequently Asked Questions
Last Updated: October 13, 2026
Why Truck Idling Drains Your Fleet Budget
Truck idling burns fuel and wears out components for zero revenue, yet most fleet managers don't track it closely enough to understand the damage, or to reduce waste truck idling costs.
Unnecessary idling is often the single biggest controllable cost drain for waste fleets.
Here's what happens during idle time:
- Fuel burns at roughly 0.8 gallons per hour with no payload movement (Idle emissions from medium heavy-duty diesel and gasoline trucks)
- Engine components wear even though the truck isn't doing productive work
- Emissions accumulate with no revenue generated
Waste fleets are especially vulnerable: idling at a dumpster while hydraulics cycle or waiting on a container swap multiplies across dozens of trucks daily.
How to Calculate Idling Fuel Costs for Your Fleet
"Idling burns about a gallon an hour" is a starting point, not an answer. Policy, technology, and coaching decisions need a fleet-specific figure. Here's a calculator you can run in a spreadsheet in under an hour.
The full idling cost formula
Total annual idling cost = (Idle hours per truck per day × Fuel burn rate × Fuel price × Fleet size × Operating days) + Maintenance premium + Emissions/aftertreatment cost
Pull each input from telematics, fuel cards, and maintenance records; use conservative defaults only where data is missing.
Inputs and where to get them
| Input | Typical range | Where to find it |
|---|---|---|
| Idle hours per truck per day | 1.5-3.0 hours for waste collection | Telematics idle-time report, or two weeks of driver logs |
| Fuel burn rate at idle | 0.6-1.0 gal/hr for heavy-duty diesel | Engine OEM spec sheet, or measured from fuel-card data |
| Fuel price per gallon | Your actual blended cost | Fuel-card statements (include taxes and surcharges) |
| Fleet size | Your count of active trucks | Fleet roster |
| Operating days per year | 250-300 for most collection operations | Route schedule |
| Maintenance premium per idle hour | $0.05-$0.15 | Compare oil analysis and PM intervals on high-idle vs. low-idle units |
Worked example
A 25-truck waste fleet, 2 idle hours per truck per day, 0.8 gal/hr burn rate, $3.50/gal diesel, 260 operating days:
- Daily idle fuel per truck: 2 × 0.8 = 1.6 gallons
- Annual idle fuel per truck: 1.6 × 260 = 416 gallons
- Fleet annual idle fuel: 416 × 25 = 10,400 gallons
Add the maintenance premium: 13,000 idle hours per year at $0.10 per hour is another $1,300 in accelerated wear, oil changes, filters, injector service, you wouldn't incur with the engine off.
Total annual idling cost: roughly $37,700, before emissions, aftertreatment, and downtime from earlier engine failure.
Why the fuel-only number understates the problem
Fuel is the visible cost; hidden costs are larger in aggregate:
- Aftertreatment and DPF loading. Extended idle produces lower exhaust temperatures, so the diesel particulate filter doesn't passively regenerate as effectively. More forced regens mean more fuel burned and shorter filter life.
- Oil dilution and shortened drain intervals. Unburned fuel seeps past the rings at idle, thinning the oil. Many high-idle fleets shorten oil drain intervals by 20-30% to compensate.
- Reduced residual value. An engine at 400,000 miles with 8,000 idle hours is not the same asset as one with 2,000 idle hours. Buyers and appraisers know the difference.
Build your own baseline in two weeks
Without telematics, have drivers log engine-on/off time for two weeks with the reason for each idle event (traffic, hydraulics, waiting on container, cab comfort, warm-up). Sort into "necessary" and "avoidable", the avoidable bucket is your reduction target, usually larger than managers expect.
Engine Wear and Hidden Maintenance Costs from Idle Time
Idling damages engines differently than driving: a moving truck runs under load at operating temperature, while idling keeps the engine cool and accelerates wear.
Extended idle time causes:
- Fuel dilution in the crankcase (unburned fuel seeping past the rings)
- Carbon buildup on intake valves and injectors
- Reduced lubrication effectiveness at lower engine temperatures
These aren't catastrophic failures but slow degradation: higher maintenance costs, shorter engine life, more repairs.
High-idle fleets often experience premature engine wear, leading to higher maintenance costs and shorter engine life.
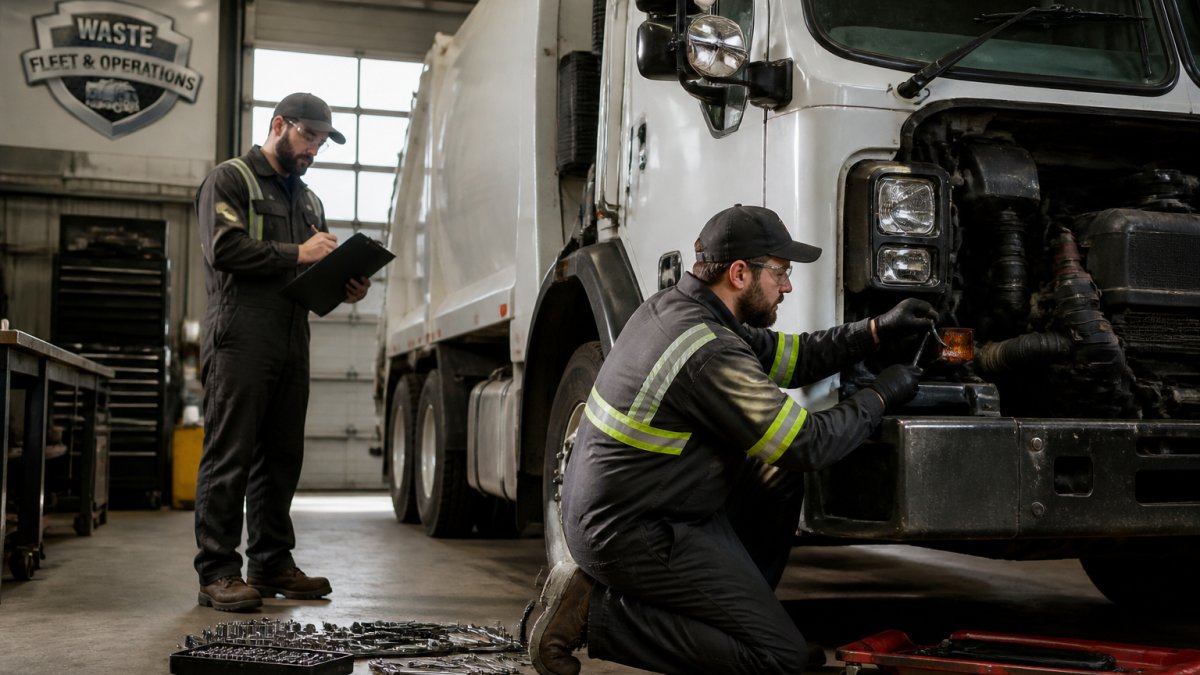
High-idle fleets also need more frequent oil changes, filter replacements, and injector cleaning, costs that add up without solving the root problem.
Establishing a Fleet Idling Policy That Drivers Will Follow
A policy on paper means nothing if drivers don't follow it, make it practical and explain why it matters.
Start with clear rules:
- No idling longer than 5 minutes for engine warm-up in cold weather
- No idling during loading or unloading (use auxiliary power instead if available)
- Turn off the engine while waiting for containers
Rules alone fail. Explain that reducing idle time affects fuel costs, competitiveness, and job stability, and you get buy-in.
Make measurement visible: post idle-time data by driver and truck, recognize reducers, and make it a team goal rather than a punishment system.
Truck Idle Reduction Technologies That Deliver ROI
Technology decisions fail on sticker price alone. Ask which option pays back fastest under your operating conditions, comparing installed cost, maintenance, fuel savings, and incentives side by side.
The four main categories, compared
| Technology | Typical installed cost per truck | Fuel savings mechanism | Best-fit operating condition | Maintenance considerations |
|---|---|---|---|---|
| Automatic engine shutdown (AES) | $500-$1,500 | Eliminates idle after a set timer (usually 5-10 min) | Urban routes with frequent short stops | Minimal; requires driver override policy |
| Auxiliary power unit (APU) | $8,000-$12,000 | Replaces main-engine idle for cab comfort and hotel loads | Cold or hot climates with long dwell times | Adds a second engine or battery system to service |
| Cab heaters / coolers (battery or fuel-fired) | $1,500-$4,000 | Heats or cools cab without main engine | Moderate climates; shorter dwell periods | Battery capacity and duty cycle must be matched |
| Telematics with idle reporting | $200-$600 per truck plus monthly service | Does not save fuel directly; enables coaching and verification | Any fleet without existing idle visibility | Subscription cost; data integration effort |
Costs vary by OEM, installation complexity, and new-versus-retrofit. Treat these as planning ranges, not quotes.
How payback actually works
Payback = installed cost ÷ annual savings. Savings come from fuel no longer burned, maintenance no longer incurred, and, for APUs and cab comfort systems, the productivity or retention benefit of comfortable drivers.
Book My Complimentary Discovery Call →
Using the earlier example fleet (25 trucks, 2 idle hours per day, $3.50/gal diesel), a 40% reduction in avoidable idle saves roughly $14,500 per year in fuel alone, about $580 per truck. Run that against each technology:
- AES at $1,000 installed: payback under two years on fuel alone, faster if maintenance savings are counted.
- Cab heater at $2,500 installed: payback in roughly four years on fuel alone, but the calculus changes if it also reduces driver complaints or cold-weather warm-up idle.
- APU at $10,000 installed: payback stretches past a decade on fuel alone in a mild climate. In a cold climate with long dwell times, or where the APU also powers tools and electronics, the math improves substantially.
Blanket recommendations are useless: the same technology that pays back in 18 months for one fleet may never pay back for another.
Operating conditions that change the answer
- Climate. Cold-weather operations get the most from cab heaters and APUs because comfort idle is a large share of total idle. Mild climates get the most from AES because comfort idle is smaller.
- Route density. Dense urban routes with many short stops favor AES. Long-haul or transfer operations with extended dwell favor APUs.
- Truck age and remaining life. A technology with a five-year payback does not make sense on a truck you plan to retire in three years.
Incentives and programs worth checking
Several programs can improve payback on idle-reduction equipment:
- Federal excise tax treatment. Certain idle-reduction devices have historically qualified for favorable tax treatment. Confirm current rules with your tax advisor, as provisions change.
- State and local air-quality programs. Many states with nonattainment areas offer grants or vouchers for idle-reduction retrofits on diesel vehicles. Check your state environmental agency and any regional air district.
- Utility and port programs. Some utilities and port authorities offer rebates for electrified or reduced-idle equipment.
Incentives can cut installed cost 20-50%, moving a marginal payback into attractive territory. Verify eligibility before assuming a program applies.
A sequencing rule that works
Do not buy technology first. Measure first. The order that produces the best return for most waste fleets is:
- Establish a baseline with telematics or driver logs.
- Separate necessary from avoidable idle.
- Coach drivers on the avoidable portion, this is free and often captures 20-30% of the opportunity.
- Add AES to lock in the gains where drivers cannot reliably self-manage.
- Add cab comfort technology only where climate and dwell times justify the cost.
- Re-measure and reinvest savings into the next tier.
Truck Driver Idle Reduction Training: Changing Behavior on the Road
Technology helps, but driver behavior is the real lever: a driver who understands idle costs and has the tools to avoid it outperforms one with perfect technology and no training.
Effective training covers three things:
-
Why it matters, Show drivers the math. If they understand that reducing idle time directly supports job security and company competitiveness, they own the goal.
-
How to do it, Teach specific techniques: pre-trip planning to minimize wait time, using auxiliary power instead of main engine, recognizing unnecessary idle situations, and using downtime productively instead of idling.
-
How to measure it, Give drivers access to their own idle-time data. Drivers who see their own numbers improve are far more likely to sustain the behavior.

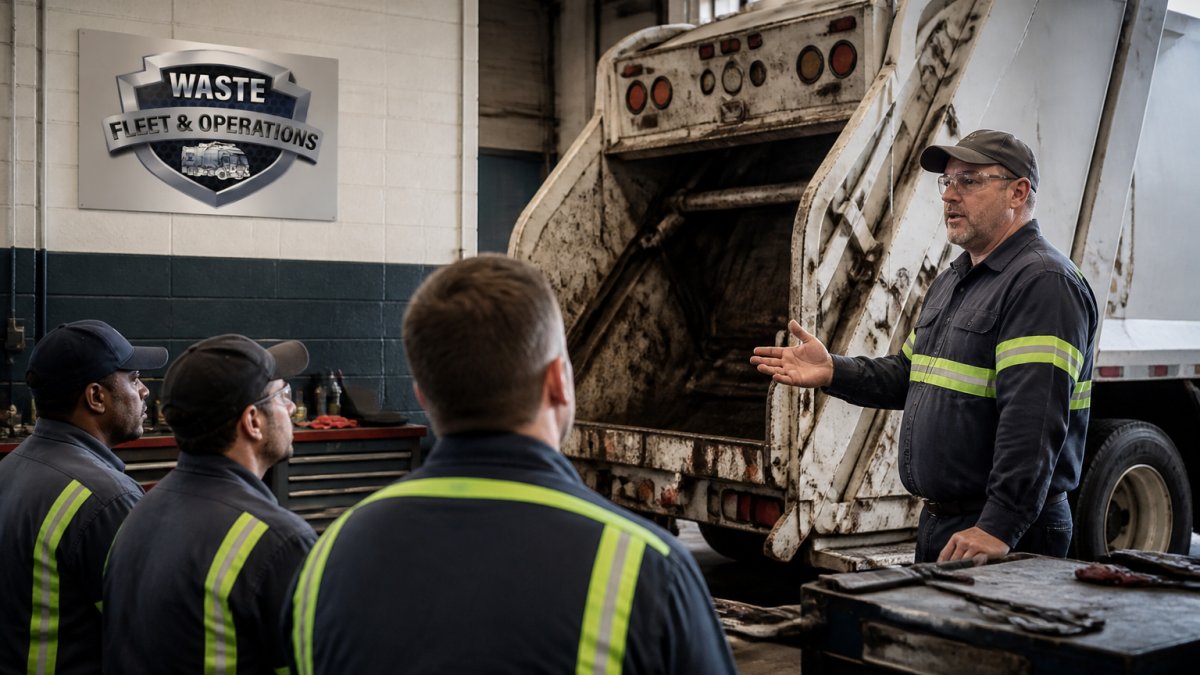
Training should come from someone with industry credibility.
Measuring and Validating Your Idling Reduction Results
Set up measurement before implementing changes so you can prove the improvement.
Start with a baseline:
- Measure idle hours per truck per day for at least two weeks
- Calculate total fuel consumption during idle time
- Document maintenance costs and breakdown frequency
After implementing policy and technology changes, measure the same metrics again at 60 days.
A realistic goal is a 30-50% reduction in idle time. Some fleets achieve more.
Track these metrics monthly:
- Total idle hours across the fleet
- Idle hours per truck per day
- Fuel costs attributable to idling
Share results with your team, celebrate wins, and adjust tactics, this is an ongoing program, not a one-time initiative.
Conclusion: Building a Sustainable Idling Reduction Program
To reduce waste truck idling costs requires three things working together: a clear policy, driver training, and measurement. Technology helps but isn't the foundation.
With margins under constant pressure, fuel and maintenance are two of your biggest controllable costs.
If your fleet struggles with high idle time, calculate your current cost, pick one tactic, a policy change or technology investment, and measure the impact after 60 days.
Frequently Asked Questions
How much does truck idling actually cost a waste fleet per year?
Costs depend on your fleet size, fuel prices, and idle hours. Calculate your specific costs using your fleet's idle hours, fuel consumption rate, and current diesel prices.
What's the difference between necessary and unnecessary idling in waste trucks?
Necessary idling includes compactor operation, hydraulic system warm-up in cold weather, and brief stops during route transitions. Unnecessary idling occurs during extended stops at transfer stations, traffic delays, or driver breaks. Distinguishing between these categories and setting clear policies can help reduce idle time. Teach drivers to shut down engines during known extended stops and use auxiliary power units for compactor operation instead of engine-driven systems.
How do I know if idle reduction training is actually sticking with my drivers?
Track idle hours weekly using telematics data or fleet management software before and after training. Measure results at 30, 60, and 90 days post-training. Combine data review with regular driver coaching and recognition for top performers. Many fleets also conduct ride-alongs with drivers to observe behavior change directly and provide real-time feedback on idling habits.
Are there legal restrictions on truck idling I need to know about?
Federal regulations limit heavy-duty truck idling to 5 minutes in most circumstances under EPA and Department of Transportation standards. Many states impose stricter limits, some states prohibit idling longer than 3 minutes. Check your state's environmental agency and motor carrier regulations for specific rules. Compliance reduces emissions penalties and positions your fleet as environmentally responsible, which can improve customer relationships and reduce regulatory risk.
Ready to cut idle costs and extend your fleet's lifespan? Book My Complimentary Discovery Call with the Waste Fleet & Operations team. We'll analyze your current idle patterns, identify the biggest cost drivers, and show you exactly how much you can save.