 Ultimate guide
Waste Truck Fleet Optimization Techniques That Work
Last Updated: November 7, 2026
Quick Summary
Waste truck fleet optimization starts with route density: packing more stops into each mile and hour so trucks finish earlier, burn less fuel, and break down less often. Layer on stop sequencing, matched pickup frequency, preventive maintenance, telematics, and workload balancing, and baseline your KPIs before changing anything so you can prove each fleet optimization technique actually worked.
- Redraw service-area boundaries before sequencing stops, then sequence by street side and traffic direction.
- Align collection schedules to actual fill rates instead of fixed weekly habits to consolidate stops.
- Sequence disposal trips so the transfer station sits on the natural return path.
- Stagger maintenance intervals across the fleet so several trucks never sit down at once.
- Use a four-week baseline and four-week test window, changing one technique at a time.
Table of Contents
- Why Waste Truck Fleet Optimization Starts With Route Density
- Waste Truck Route Optimization: Cutting Redundant Mileage and Travel Time
- Waste Fleet Preventive Maintenance That Prevents Road Calls
- Waste Fleet Telematics: Turning GPS Data Into Dispatch Decisions
- Waste Truck Use: Workload Balancing Across Trucks and Drivers
- A Measurement Framework: Baseline KPIs Before You Change Anything
- Real-World Constraints, Exception Handling, and Waste-Stream Differences
- Book a Complimentary Discovery Call to Audit Your Fleet
- Frequently Asked Questions
Why Waste Truck Fleet Optimization Starts With Route Density
Waste truck fleet optimization begins with route density: the number of stops packed into each mile and each hour of a driver's day.
Density is the foundation every other technique rests on. Get it wrong and no amount of telematics or maintenance discipline will recover the lost hours. Get it right and the savings compound across fuel, labor, and vehicle wear.
Stop Sequencing and Service-Area Boundaries
Stop sequencing is the order in which a truck services its stops, and it matters more than most managers expect. A poorly sequenced route sends a truck past the same intersection three times.
The practical fix is to redraw service-area boundaries before touching sequence. Assign each truck a compact territory, then sequence stops within it by street side and traffic direction.
Pickup Frequency and Collection Schedules
Pickup frequency drives density as much as geography does. Routes built around fixed weekly schedules often run half-empty trucks through low-volume areas. Aligning collection schedules to actual fill rates, rather than habit, lets you consolidate stops on the same day and tighten the loop.
Many haulers find that shifting commercial accounts to matched frequency windows produces immediate gains. The schedule change costs nothing. It simply stops sending trucks where there is nothing to collect.
Waste Truck Route Optimization: Cutting Redundant Mileage and Travel Time
Waste truck route optimization is the process of designing collection paths that minimize travel distance and travel time while meeting every service commitment.
Start with route efficiency techniques that cut redundant mileage step by step, then apply them route by route rather than fleet-wide. Haulers who optimize one route, measure it for two weeks, and then roll out the change see far better adoption than those who redraw everything at once.
Transfer Station and Disposal-Site Routing
Disposal-site routing is where route plans quietly fall apart. A truck that finishes collection at the far end of its territory and then drives across town to the transfer station loses the density gains it earned all morning.
Sequence disposal trips so the transfer station sits on the natural return path. Where multiple disposal sites exist, assign trucks to the nearest site by route end point, not by company habit.
Waste Fleet Preventive Maintenance That Prevents Road Calls
Waste fleet preventive maintenance is scheduled inspection and service work performed before a component fails, designed to keep vehicles available and road calls rare. Breakdowns are rarely sudden.
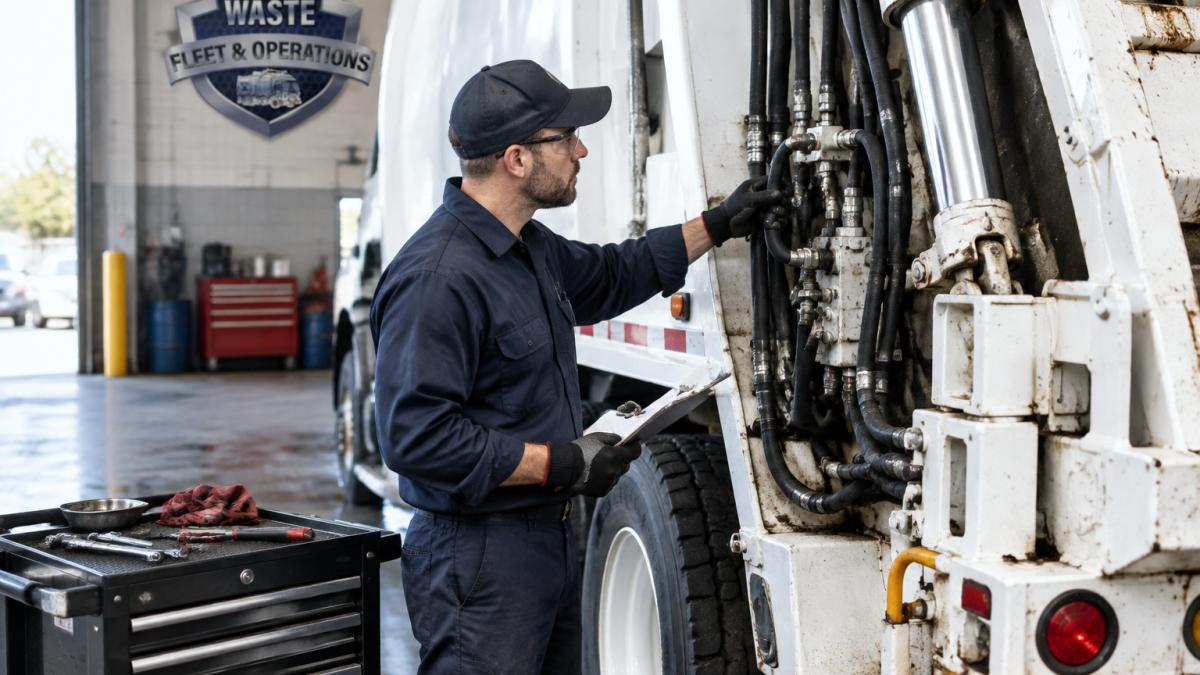
A common mistake is treating preventive maintenance as a paperwork exercise. For a deeper look at preventive maintenance strategies for sanitation trucks, build the program around your actual duty cycles rather than a generic mileage chart.
Maintenance Scheduling and Vehicle Availability
Maintenance scheduling should protect vehicle availability, not just record it. Schedule service in off-peak windows, stagger intervals across the fleet so several trucks never sit down at once, and track availability as an operating metric rather than a shop concern.
When shop floor and management communicate on the same schedule, availability improves without adding a single truck to the fleet.
Waste Fleet Telematics: Turning GPS Data Into Dispatch Decisions
Waste fleet telematics is the use of GPS and vehicle sensor data to inform dispatch, routing, and maintenance decisions in real time. The technology is not the hard part. Most haulers already collect more route data than they use.
The gap is interpretation. GPS data tells you a truck idled for 40 minutes. It does not tell you why. Dispatch decisions improve when someone reviews the pattern weekly: which stops consistently run long, which drivers finish early, which vehicles trigger fault codes before a road call.
Waste Truck Use: Workload Balancing Across Trucks and Drivers
Waste truck use measures how much productive work each vehicle and driver completes per shift. Workload balancing spreads collection volume across the fleet so no truck runs overloaded while another finishes at noon.
Balance by route, not by seniority. Assign stop counts and estimated service time to each route, then redistribute the outliers. Driver performance data helps here, but use it to fix routes, not to blame people.
Fuel Consumption, Idle Time, and Operating Costs
Fuel consumption, idle time, and operating costs move together. Idling burns fuel without moving a pound of waste, and it accelerates engine wear (Alternative Fuels Data Center: Idle Reduction).
Our guide to reducing waste truck idling costs covers the operational levers in detail. The core discipline is simple: set an idle policy, measure it through telematics, and review exceptions with drivers weekly.
A Measurement Framework: Baseline KPIs Before You Change Anything
Baseline KPIs are the pre-change measurements that let you prove whether a fleet optimization technique actually worked. Measure first. Optimize second. Otherwise you cannot tell improvement from seasonal variation, and you cannot defend a schedule change to a skeptical driver or a commercial customer who noticed a different pickup window.
The gap in most fleet optimization advice is that it names metrics without defining them. A metric you cannot calculate the same way twice is not a baseline, it is an opinion.
Core KPI Formulas and Baseline Methods
| Metric | Formula | Primary Data Source | Baseline Method | Review Cadence |
|---|---|---|---|---|
| Cost per stop | (Fully loaded route cost) ÷ (Completed stops) | Payroll, fuel, maintenance, disposal, and route completion records | Average the prior 8-12 weeks of completed routes, excluding holiday weeks and known outage days | Monthly |
| Miles per pickup | Total route miles ÷ Completed pickups | Telematics odometer plus route completion log | Same 8-12 week window, segmented by route type (residential, commercial, roll-off) | Weekly |
| On-time service rate | (Stops completed inside the service window) ÷ (Scheduled stops) | Telematics timestamps matched to customer time windows | Prior 4 weeks, reported by route and by day of week | Weekly |
| Fuel per route | Gallons dispensed ÷ Routes completed | Fuel card or bulk tank records reconciled to route IDs | Prior 8 weeks, normalized for seasonal temperature and tonnage | Monthly |
| Vehicle utilization | (Productive route hours) ÷ (Available vehicle hours) | Telematics engine hours minus idle and shop time | Prior quarter, reported per truck | Monthly |
| Missed-pickup rate | (Missed pickups) ÷ (Scheduled pickups) | Dispatch exception log and customer call records | Prior 8 weeks, with reasons coded (access, overflow, breakdown, scheduling) | Weekly |
Two rules make these numbers trustworthy. First, define the denominator before you start, a "stop" is a serviced account, not a container, and a "pickup" is a completed service event, not a scheduled one. Second, freeze the baseline window.
Watch out: cost per stop is the metric most often distorted by allocated overhead. Decide up front whether dispatch salaries, shop labor, and disposal fees are spread per route, per stop, or per ton, and apply the same allocation to the baseline and the post-change period.
Turning Baselines Into a Before-and-After Test
A baseline is only useful if it is paired with a test design. Pick one route or one small service area, record the baseline metrics for at least four weeks, apply a single technique, and hold everything else steady.
A four-week baseline and a four-week test window is a reasonable minimum to survive normal variation, weather, holiday shifts, and a single truck breakdown can swamp a one-week comparison. A structured approach to tracking waste fleet maintenance KPIs keeps those definitions consistent across quarters.
Report the results in the same format every time: baseline value, test value, percent change, and the operational reason you believe the change occurred. That last column is what turns a dashboard into a decision.
Real-World Constraints, Exception Handling, and Waste-Stream Differences
Exception handling separates a plan on paper from a route that survives a Monday morning. Bulk pickups, missed pickups, blocked streets, and holiday volume all break the ideal sequence. Treat constraints as inputs to route design rather than surprises to absorb after the fact.
A Constraint Framework for Route Design
Every waste route operates inside six constraint families. If your routing tool or dispatcher does not account for all six, the plan will fail on the street even when the math looks clean.
- Vehicle capacity and payload limits. A rear-loader, front-loader, and roll-off each hit gross vehicle weight and volume limits at different stop counts. Route density must be capped by the truck that actually serves the route, not by an average. Know the practical payload ceiling for each body type and the tonnage at which the truck must leave for disposal.
- Time windows and access restrictions. Commercial accounts often have delivery-window conflicts, gate codes, or dock schedules. Residential streets may restrict heavy trucks during school hours or early morning. Encode these as hard constraints in sequencing, not as notes the driver is expected to remember.
- Road restrictions and physical access. Low clearances, weight-restricted bridges, narrow lanes, and cul-de-sacs with no turnaround change which truck can serve which stop. A route that is legal for a rear-loader may be impossible for a roll-off.
Watch out: capacity constraints are the most common reason an optimized route fails in practice. A sequence that minimizes miles but sends a truck to disposal twice in one shift can cost more than the mileage it saved.
Exception Rules That Keep Routes Recoverable
Build exception rules into the route design itself: a defined overflow stop order, a documented missed-pickup response with a service-recovery window, and a dispatch trigger when a truck falls a set number of stops behind schedule.
A practical pattern is to reserve a small buffer of route time for exceptions and to code every exception by cause (access, overflow, breakdown, scheduling).
Waste-Stream Operating Differences
Waste streams behave differently, and one optimization template will not serve them all. The table below summarizes the operating logic for each stream.
| Stream | Routing Logic | Dominant Constraint | Frequency Pattern |
|---|---|---|---|
| Residential rear-load | Dense loops, one side of street at a time, minimal backtracking | Stop density and truck weight limits on residential streets | Fixed weekly, often same-day |
| Commercial front-load | Tight density with matched frequency windows | Time windows, dock access, and container size | Matched to fill rate, multiple visits per week |
| Recycling | Route density similar to residential, but contamination and sorting slow service | Contamination checks and processing-site hours | Fixed, often biweekly |
| Organics | Dense routes with weight-sensitive payloads | Payload weight and odor/containment handling | Frequent, especially in warm months |
| Bulky-item | Appointment-driven, low stop count, high service time per stop | Time windows and truck/crew configuration | On-demand or scheduled pickup days |
| Roll-off | Disposal-site turnaround drives the plan, not stop count | Haul distance to disposal and container availability | On-call, driven by customer fill rate |
Commercial front-load routes favor tight density and matched frequency. Residential rear-load routes tolerate more spread but punish backtracking. Roll-off operations are driven by disposal-site turnaround, not stop count. Recycling and organics add processing-site hours and contamination handling to the routing problem.
Book a Complimentary Discovery Call to Audit Your Fleet
Route density, maintenance discipline, and workload balance are learnable techniques, but applying them inside a live operation takes an outside eye.
Waste Fleet & Operations builds engagements around your operation, not a template. Learn more about our waste fleet operational audit services and what an engagement covers.
The gap between a fleet that limps through the week and one that runs on schedule is rarely a single big fix.
Frequently Asked Questions
How can waste collection routes be optimized without buying new software?
Start with the data you already have. Pull GPS history for two to four weeks and map where trucks idle, backtrack, or cross the same street twice. Re-sequence stops by density so each mile collects more cans, tighten service-area boundaries so trucks stop crossing zones, and align pickup frequency with actual fill rates instead of habit. These changes alone often recover meaningful travel time before any route optimization software is purchased.
What maintenance practices help improve waste truck fleet performance?
Waste fleet preventive maintenance works best when it is built around duty cycle rather than calendar dates. Garbage trucks endure constant stop-start braking, hydraulic cycling, and compaction loads, so brake, hydraulic, and PTO inspections should follow hours and miles, not a generic monthly schedule. Pair that with daily driver walkarounds, fluid sampling, and root cause analysis on every repeat failure. Catching small issues in the shop prevents the road calls that take a truck out of service mid-route.
How can telematics help optimize a waste truck fleet?
Waste fleet telematics turns raw GPS data into decisions. Use it to measure idle time at each stop, verify that drivers follow the planned route sequence, flag harsh braking and speeding that shorten brake life, and trigger maintenance alerts from fault codes. The value comes from reviewing the data weekly with dispatch and shop staff, not from installing the device. Fleets that act on telematics reports typically find redundant mileage and excessive idle time within the first month.
What are the key metrics for measuring waste fleet efficiency?
Track a small set of baseline KPIs: stops per hour, miles per stop, fuel used per route, idle time percentage, missed pickups, road calls per 1,000 miles, and vehicle availability. Capture four to six weeks of baseline data before changing anything so you can prove whether a technique actually worked. Review the numbers monthly with both shop and operations staff. Without a baseline, improvements are anecdotes rather than evidence.
How can fleet managers reduce waste truck downtime?
Downtime usually traces back to deferred preventive maintenance and repeat failures that were never root-caused. Build a maintenance schedule tied to actual usage, keep critical spares on the shelf, and have technicians document the cause of every failure so patterns surface. Cross-train drivers to report symptoms early. Combining structured preventive maintenance with root cause analysis can help reduce breakdowns over time.
How can waste haulers improve truck utilization across the fleet?
Look at workload balance first. If two trucks in the same area finish hours apart, redistribute stops so each vehicle carries a similar load. Match truck type to route: a rear loader on a long residential route wastes capacity compared with a side loader. Review start times so trucks are not queued at the transfer station at the same hour. Utilization improves when dispatch, routing, and maintenance planning are reviewed together rather than in isolation.